
September employment surprised to the upside
Chief Economist Eugenio J. Alemán discusses current economic conditions.
Although the September employment report surprised to the upside, the overall stance of the US labor market remains weak, something that was underscored by the third consecutive increase in the rate of unemployment, from 4.1% in June to 4.4% in September. But the problem with this data point is that we will never know the rate of unemployment for the month of October; and, although we will get delayed information on the rate of unemployment for November, that data is going to come in after the Federal Reserve Federal Open Market Committee (FOMC) meeting ends, which will not be helpful for the Fed’s interest rate decision.
Markets seemed to have concluded, after the initial euphoria on the back of NVIDIA’s results, that the strength in the labor market in September, plus the lack of data releases (or the delay of these releases) for employment in October and November, was enough to definitely upend the market’s expectations for another rate cut in December. If markets continue to believe this is the case, it will become a fulfilled prophecy, as the Fed typically takes market expectations into consideration. Clearly, Fed officials, except for the most dovish ones, including the latest Donald Trump appointee, Stephen Miran, have been arguing that a December cut was not a sure thing. It seems that they have been successful, so far, in convincing the markets that this time they will pass on cutting rates.
We, on the other hand, believe that even if the September employment number was stronger than expected, the stance of the US labor market is still worrisome. We believe labor market weakness will be evident when the Bureau of Labor Statistics releases the October and November employment numbers. By then, however, the December Fed decision will be in the rear-view mirror, and we will be trying to predict the direction of rates in 2026, which remains far from clear.
Delayed data releases compound economic analysis issues
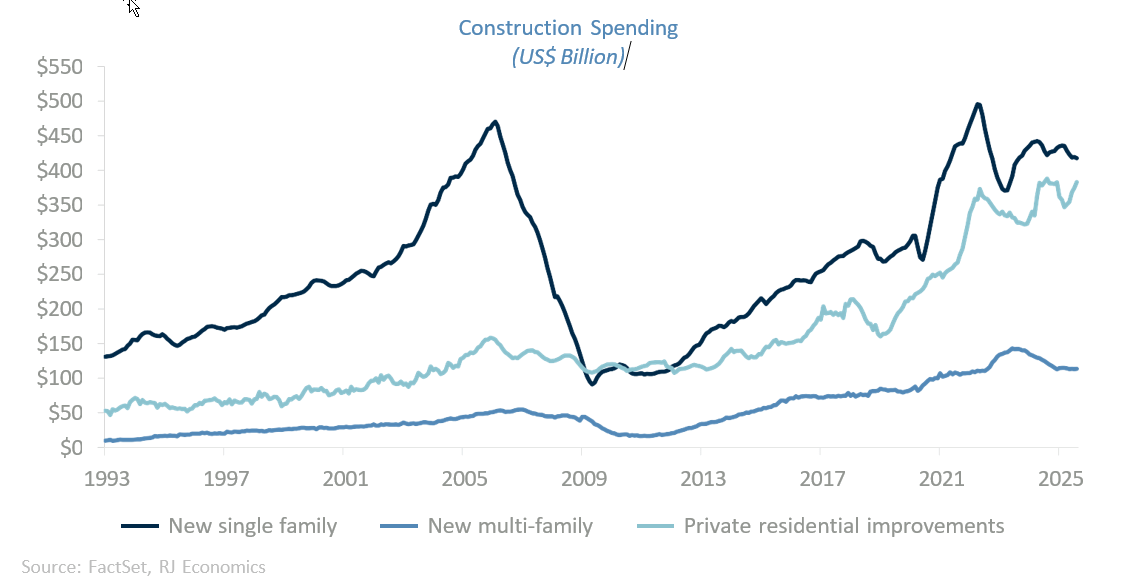
Monday’s release of the first delayed construction spending report for August had a big surprise: residential construction spending surged by 0.8% during the month. However, when looking at the details of the report, new single family homes construction spending declined by 0.4% while new multifamily construction spending increased by just 0.2%, all month-on-month. That is, the new residential market construction sector was very weak during the month of August, as new single family construction spending represents 45.7% of all residential construction spending while new multifamily construction spending represents only 12.4% of residential construction spending.
Thus, the driver of the strong growth in residential construction spending during the month of August was spending on private residential improvements. This component of residential construction spending accounted for about 42% of all residential construction spending during the month of August.
This component is part of what goes into the calculation of residential investment and has become an important contributor in the recent past, as shown in the graph below.
This private residential improvements component is different from the retail sector’s building materials and garden supply stores, which includes the do-it-yourself component for home renovations. The latter is part of consumption expenditures rather than the investment component of GDP, as is the case for the private residential improvement sector. However, the correlation between these two sectors (private residential improvements and building materials and garden supply) is about 95%.
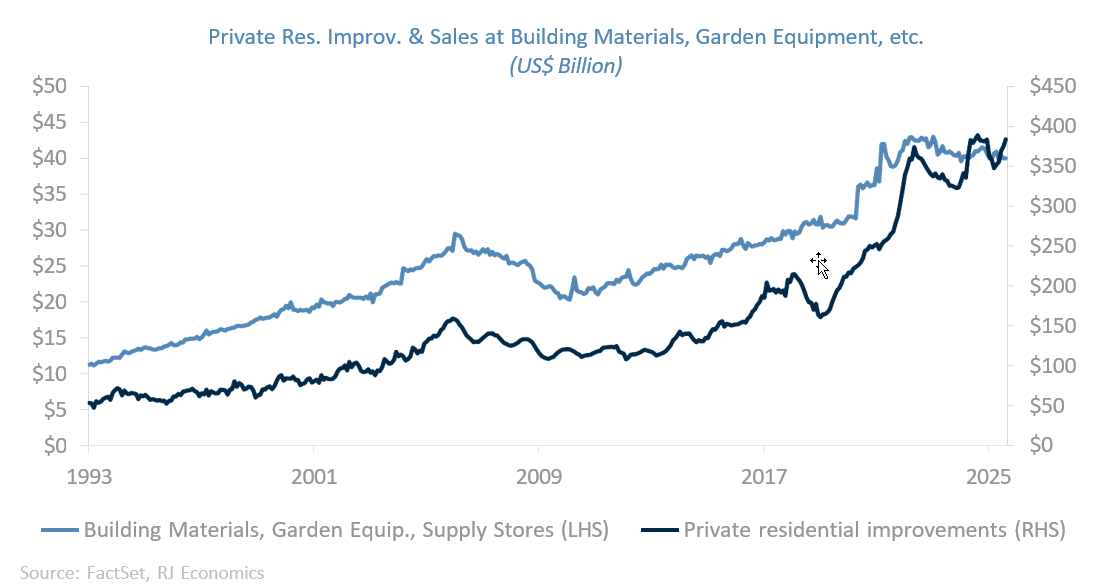
Since we heard this week that Home Depot, with almost 30% share of this market, missed third-quarter estimates while lowering full-year profit estimates, it is possible that this part of investments also weakened at the end of the third quarter of the year.
Another piece of alternative information from the consumer side comes from the National Retail Federation. This release showed that retail sales in September were very weak, declining by 0.66% on a month-over-month basis. The US Census will release the September retail sales report next week, on November 25, which will probably also show weakness at the end of the third quarter of the year. This information, as well as revisions to previous months, will be used to calculate personal consumption expenditures – a major component of real GDP during the third quarter of the year. Thus, next week we will be focusing on the performance of the control group sales within the retail sales report.
The National Retail Federation also showed that retail sales partially recovered during the month of October, growing by 0.6% month-over-month, which is good news entering the last quarter of the year.
Bottom Line
While September’s employment report came in stronger than expected, the underlying labor market remains fragile amid a steady rise in unemployment. Additionally, October job cuts per the privately-sourced Challenger survey were the highest since the Great Financial Crisis, underscoring the recent weakness. Signs of weakening consumer spending and potentially softer private investments suggest broader economic momentum is slowing as well. Furthermore, the lack of data as of a result of the longest government shutdown resulted in market expectations aligning with the Fed’s recent messaging: The December rate cut is far from certain.
Economic and market conditions are subject to change.
Opinions are those of Investment Strategy and not necessarily those of Raymond James and are subject to change without notice. The information has been obtained from sources considered to be reliable, but we do not guarantee that the foregoing material is accurate or complete. There is no assurance any of the trends mentioned will continue or forecasts will occur. Past performance may not be indicative of future results.
Consumer Price Index is a measure of inflation compiled by the US Bureau of Labor Statistics. Currencies investing is generally considered speculative because of the significant potential for investment loss. Their markets are likely to be volatile and there may be sharp price fluctuations even during periods when prices overall are rising.
Consumer Sentiment is a consumer confidence index published monthly by the University of Michigan. The index is normalized to have a value of 100 in the first quarter of 1966. Each month at least 500 telephone interviews are conducted of a contiguous United States sample.
Personal Consumption Expenditures Price Index (PCE): The PCE is a measure of the prices that people living in the United States, or those buying on their behalf, pay for goods and services. The change in the PCE price index is known for capturing inflation (or deflation) across a wide range of consumer expenses and reflecting changes in consumer behavior.
The Consumer Confidence Index (CCI) is a survey, administered by The Conference Board, that measures how optimistic or pessimistic consumers are regarding their expected financial situation. A value above 100 signals a boost in the consumers’ confidence towards the future economic situation, as a consequence of which they are less prone to save, and more inclined to consume. The opposite applies to values under 100.
Certified Financial Planner Board of Standards Center for Financial Planning, Inc. owns and licenses the certification marks CFP®, CERTIFIED FINANCIAL PLANNER®, and CFP® (with plaque design) in the United States to Certified Financial Planner Board of Standards, Inc., which authorizes individuals who successfully complete the organization’s initial and ongoing certification requirements to use the certification marks.
Links are being provided for information purposes only. Raymond James is not affiliated with and does not endorse, authorize or sponsor any of the listed websites or their respective sponsors. Raymond James is not responsible for the content of any website or the collection or use of information regarding any website's users and/or members.
GDP Price Index: A measure of inflation in the prices of goods and services produced in the United States. The gross domestic product price index includes the prices of U.S. goods and services exported to other countries. The prices that Americans pay for imports aren't part of this index.
Employment cost Index: The Employment Cost Index (ECI) measures the change in the hourly labor cost to employers over time. The ECI uses a fixed “basket” of labor to produce a pure cost change, free from the effects of workers moving between occupations and industries and includes both the cost of wages and salaries and the cost of benefits.
US Dollar Index: The US Dollar Index is an index of the value of the United States dollar relative to a basket of foreign currencies, often referred to as a basket of U.S. trade partners' currencies. The Index goes up when the U.S. dollar gains "strength" when compared to other currencies.
The FHFA HPI is a broad measure of the movement of single-family house prices. The FHFA HPI is a weighted, repeat- sales index, meaning that it measures average price changes in repeat sales or refinancings on the same properties.
Import Price Index: The import price index measure price changes in goods or services purchased from abroad by U.S. residents (imports) and sold to foreign buyers (exports). The indexes are updated once a month by the Bureau of Labor Statistics (BLS) International Price Program (IPP).
ISM Services PMI Index: The Institute of Supply Management (ISM) Non-Manufacturing Purchasing Managers' Index (PMI) (also known as the ISM Services PMI) report on Business, a composite index is calculated as an indicator of the overall economic condition for the non-manufacturing sector.
The ISM Manufacturing Index: The GDP Now Institute of Supply Management (ISM) Manufacturing Measures the health of the manufacturing sector by surveying purchasing managers at manufacturing firms. The survey asks about current business conditions and expectations for the future, including new orders, inventories, employment, and deliveries.
Consumer Price Index (CPI) A consumer price index is a price index, the price of a weighted average market basket of consumer goods and services purchased by households.
Producer Price Index: A producer price index (PPI) is a price index that measures the average changes in prices received by domestic producers for their output.
Industrial production: Industrial production is a measure of output of the industrial sector of the economy. The industrial sector includes manufacturing, mining, and utilities. Although these sectors contribute only a small portion of gross domestic product, they are highly sensitive to interest rates and consumer demand.
The NAHB/Wells Fargo Housing Opportunity Index (HOI) for a given area is defined as the share of homes sold in that area that would have been affordable to a family earning the local median income, based on standard mortgage underwriting criteria.
Conference Board Coincident Economic Index: The Composite Index of Coincident Indicators is an index published by the Conference Board that provides a broad-based measurement of current economic conditions, helping economists, investors, and public policymakers to determine which phase of the business cycle the economy is currently experiencing.
Conference Board Lagging Economic Index: The Composite Index of Lagging Indicators is an index published monthly by the Conference Board, used to confirm and assess the direction of the economy's movements over recent months.
New Export Index: The PMI New export orders index allows us to track international demand for a country's goods and services on a timely, monthly, basis.
Gold is subject to the special risks associated with investing in precious metals, including but not limited to: price may be subject to wide fluctuation; the market is relatively limited; the sources are concentrated in countries that have the potential for instability; and the market is unregulated.
The Conference Board Leading Economic Index: Intended to forecast future economic activity, it is calculated from the values of ten key variables.
Source: FactSet, data as of 10/17/2025
